
Why Screening on Down Days Exposes True Market Leaders
When markets decline, selling pressure tends to be broad. Indexes fall, sentiment weakens, and most stocks move lower alongside the general trend. But during these pullbacks, a small group of stocks often behaves differently. Some hold steady. A few even rise. That divergence is rarely random.

Stocks that resist market weakness are often demonstrating underlying demand. While the broader tape reflects fear or risk reduction, these names show that buyers are willing to step in regardless of external pressure. That resilience frequently appears before a stock emerges as a clear leader.
In strong markets, nearly everything advances. In weak markets, leadership reveals itself.
The Role of Relative Strength
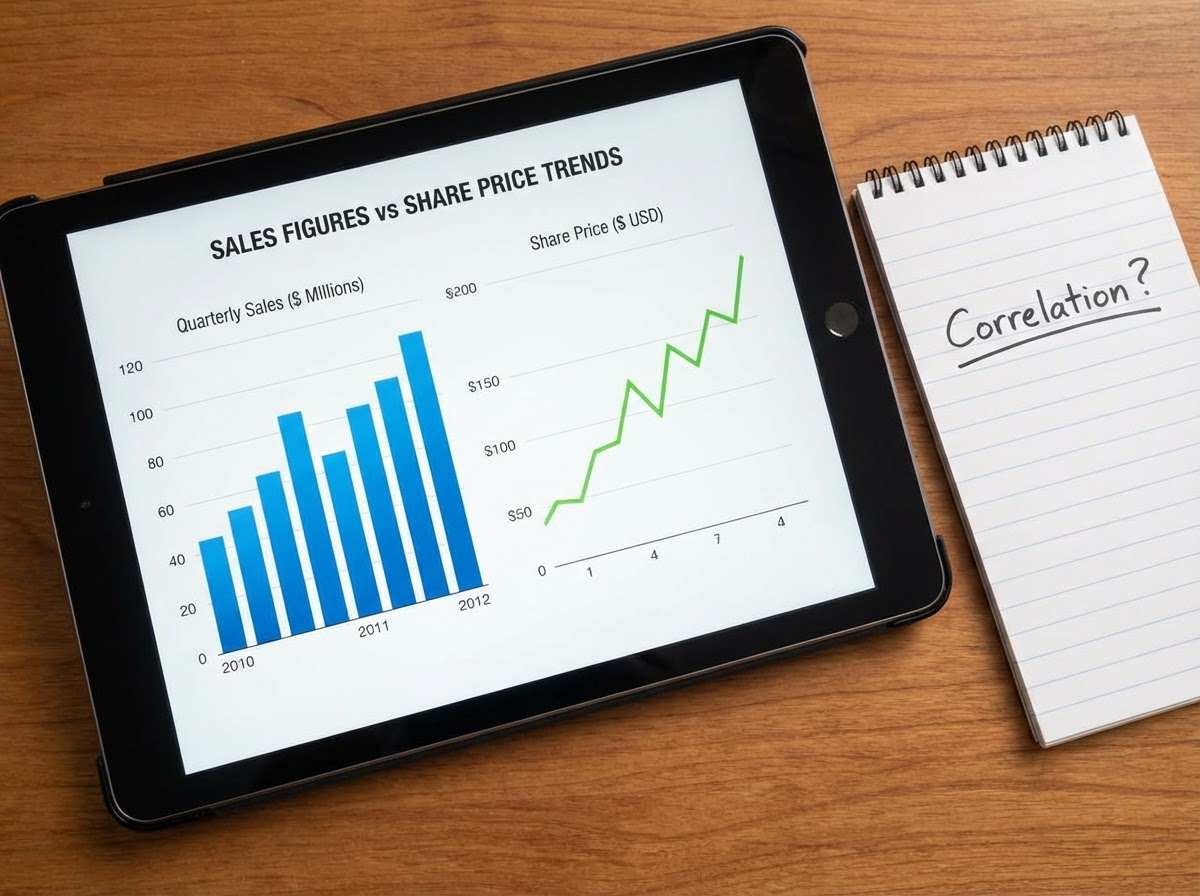
Relative strength (RS) measures how a stock performs compared to a benchmark such as the S&P 500. Rather than focusing only on whether a stock is rising or falling, relative strength asks a more important question:
Is this stock outperforming the broader market?
Outperformance can show up in two key ways:
- If the market rises 10% and a stock rises 20%, it is outperforming.
- If the market declines 10% and a stock drops only 5%, it is still outperforming because it is holding up better.
Conversely, stocks that fall more than the market during corrections — or lag during rallies — are displaying relative weakness.
Relative strength highlights where capital is flowing. It shows which stocks investors are defending — and which they are abandoning.
Why Down Days Provide the Clearest Signals
Market pullbacks act as stress tests. When fear rises, investors must decide what to sell and what to keep. Institutions managing large portfolios often become selective during these periods, trimming weaker holdings while maintaining or adding to high-conviction positions.
Stocks that stay green while the broader indexes turn red often reflect:
- Reduced selling pressure
- Persistent institutional demand
- Quiet accumulation
Screening for stocks that rise — or simply refuse to fall — on weak days can surface leadership before it becomes obvious to the broader market.
When the market eventually stabilizes, these resilient names are frequently among the first to break out.
Using Relative Strength to Identify Leaders
The Relative Strength Line
The relative strength line compares a stock’s performance directly to the market over time. When the RS line trends upward, the stock is outperforming. When it trends downward, the stock is lagging.
One particularly powerful signal occurs when the RS line reaches new highs — even before the stock itself breaks out to new price highs.
A new high in the RS line suggests that the stock is outperforming the majority of the market. That kind of leadership often attracts institutional capital and can precede sustained advances.
Stocks with RS lines making fresh highs are often emerging leaders within their sectors.
Tracking Relative Strength Days
Another way to measure consistent leadership is by counting “relative strength days” — sessions where a stock outperforms the broader index.
For example:
- If the market declines and a stock falls less, that qualifies.
- If the market rises and the stock gains more, that also qualifies.
Tracking how frequently a stock demonstrates outperformance helps determine whether strength is persistent or temporary.
In volatile or corrective environments, stocks that outperform on more than half of trading days often represent higher-quality leadership candidates. Consistent outperformance signals steady institutional support rather than a short-term bounce.
Additional Technical Clues That Reveal Strength
Oops Reversals: Signs of Strong Demand
An “Oops Reversal” is a bullish reversal pattern that often appears near turning points.
It begins with a gap down below the previous day’s low — a move that initially looks bearish. But instead of continuing lower, the stock reverses during the session, climbs back into the prior range, and closes above the previous close.
This intraday shift from weakness to strength suggests aggressive buying interest. Sellers lose control, and buyers take over before the close.
When this pattern appears after a prolonged decline or within a tight consolidation, it can signal accumulation and potentially mark the beginning of a larger move.
The defined low of the reversal day also provides a clear risk level for traders.
Open = Low: Early Institutional Control
The “open equals low” pattern occurs when a stock opens and never trades below that opening price throughout the day.
This behavior indicates immediate demand at the open. Buyers step in early and maintain control for the entire session.
On days when the broader market is falling, stocks that open at their lows and trend higher stand out even more. They are attracting capital while others are under distribution.
This setup becomes more meaningful when accompanied by strong volume or a positive close, as it suggests committed participation rather than light trading.
It also offers a well-defined risk point: the day’s low is already established.
Why This Matters
Stocks that resist declines often lead the next advance. They demonstrate relative strength when conditions are unfavorable — which is precisely when real leadership emerges.
By screening for:
- Stocks that rise on market down days
- RS lines making new highs
- High frequency of relative strength days
- Bullish reversal patterns
- Open = low sessions
You increase the odds of identifying institutional favorites before they make large moves.
Markets reward preparation. The strongest stocks rarely announce themselves loudly at first. They reveal their strength quietly — especially when the rest of the market is struggling.
Those who learn to look for resilience during weakness often position themselves ahead of the next wave of leadership.